|
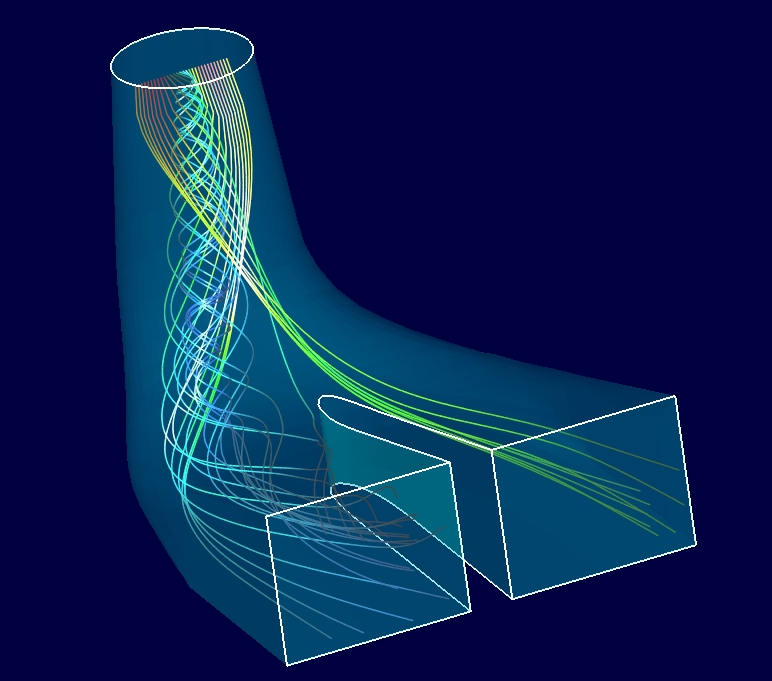
Display of isolines, streamlines, particles; data probe; integrated calculator; export in png and PostScript format: here are some of the features available in our products.
Data Structure
- Structured, unstructured and hybrid meshes
- Scalar, vector and symmetric tensor fields
- Non-restricted number of solution fields
File Access
- Reading of compressed files (z,Z,gz,bz)
- User-transparent file transfer through the following protocols: http, ftp or vu (VU protocol)
- User-transparent transfer of data being calculated or visualized, onto another computer
Regions
- Cutting planes according to the domain origin (X,Y,Z)
- Cutting planes at arbitrary orientations, indicated by the user or modified interactively
- Cutting spheres or cylinders
- Display of the intersected elements or of the cutting plane in those elements
- Mesh curvilinear lines or surfaces (I,J,K)
- Isosurfaces of a variable or of a mathematical expression of a secondary variable
- Domain boundaries
- Injectors (points and 1D, 2D or 3D rakes)
- Sweeping between two cutting planes, two curvilinear surfaces or two isosurfaces
Integrated Calculator
It is possible to combine the various solution fields for the creation mathematical expressions, and to extract and display data information in a dynamic way.
- Mathematical expressions to indicate values for:
- isolines and isosurfaces
- color mapping
- particle radius
- vector field components
- deformation
- scaling factors
- data extraction
- etc.
- Expressions made from variables, constants, functions, as well as relational and conditional operators. Examples: var1-var2, var1/2, var1%15, var1>0?log(var1):0, sqrt(U*U+V*V+W*W)
- Mathematical functions corresponding to the libm.a library
- Calculation of elements volumes
- Calculation of continuous variables from Taylor-type discontinuous variables
- Calculation of total derivatives and partial derivatives
- Calculation of the stream function for 2D domains
- New expressions entered by the user can be saved for subsequent use
Mesh
- Selection of blocks
- Display of nodes and elements numbers
- Varied colors for the different blocks
- Visual shrinking of the elements (elements can be made smaller when displayed)
- Elimination of the mesh internal surfaces
Isolines and isosurfaces
- Isosurfaces of any variable or expression
- Isolines of any variable or expression, on any 2D support
- Display of the value of each isoline or isosurface
- Output of values to a file
Graphs
- Surfaces in color gradation
- Shading (uniform or according to Gouraud algorithm)
- Color mapping (constant or variable by element)
Streamlines and Particles
- On-the-fly calculation and interactive control of the injection
- Displayed as lines/tubes and spheres
- Control of the calculation accuracy, graphical display interval, injection interval, and life span
- Size of the particle according to a variable or expression
- Integration across the boundaries of blocks or meshes
- Injection from points, lines (rakes), surfaces or cubes (points, circles, discs, spheres), from arbitrary coordinates, from the geometry, or from mesh nodes
- Interactive modification of injection positions
- Color mapping according to a variable or an expression, or varied, according to the injection point, to follow a trajectory
Vectors
- Displayed as arrows or cones
- Vector size according to the probed variable
- Size control (scaling factor or normalized length)
Tensors
- For second order symmetric tensor field, in 2D or 3D
- Calculation of the tensor's main axes at the nodes of the mesh
- Display of the eigenvectors as axes or ellipsoids
- Normalization by the eigenvalues
Data Probe
- Quantitative extraction in 0D, 1D, 2D or 3D
- Interactive probe on the screen
- Extraction of the node and element numbers, coordinates and value of each variable
- Redirection of values to gnuplot for graphic display
- Facilitation of the first steps for the development of simulation programs
- Output to a file to specify initial conditions for a subsequent simulation, or for comparison purposes
Geometry
- Nurbs or simple curves and surfaces
- Precise selection of the geometric elements to be displayed
Chemistry
- Atoms and bonds colored according to the standard chemistry representations
- Automatic display of bonds according to the van der Waals radius
- Display of the atoms according to the covalent or the van der Waals radius
- Visualization of molecular surfaces
Animation
- To study transient phenomena, to follow the evolution of an adaptive mesh or to illustrate the parametric study of the solution.
- Reading and animation of files with 3D images instead of 2D projections: rotation, translation and zoom functions are still available
- Interactive control of the animation
- Saving of the animation in high quality PostScript files or ppm
- Direct saving of the animation in a mpeg file
Display Features
- No internal limit on the number of images that can be displayed simultaneously
- Multiple displays of the same image with rotation and translation, to mirror axisymmetric data or to repeat periodic block
- Thresholding to accurately select the values to be displayed
- Color mapping and transparency (constant, or according to a variable or an expression)
- Elimination (culling) of the domain's front or back faces
- Offset of the image (displayed at a certain distance from the probe)
- Deformation (elevated surface) adjustable according to any variable or expression
- Offset and deformation done independently on the three axes (X,Y,Z)
Image Output
- Portable Network Graphics (png), for insertion in web sites or documents
- Vector PostScript (screen-resolution independent), or matrix (bitmap) PostScript, for insertion into documents
- Portable pixmap (PPM). Can be used to create images in tiff, gif or other format
- mpeg video
|